Visualizing 60 years of International Commerce
Author: Xavier Fernández-i-Marín
December 19, 2011 - 4 minutes
R Spatial modelsCommercial ties between countries
Recent trends in Comparative Political Analysis include the addition of spatial techniques. By means of spatial techniques the factors that help explaining a feature of countries go beyond the usual “internal” factors and include the interaction of countries between them.
The economic links between countries seem to be amongst the most used indicators of relationship between countries. Other measures include the distances, or whether the countries share regional borders.
Kristian Skrede Gleditsch has worked in providing estimates of trade flows between independent states (1948-2000). The dataset presents the amount of imports and exports between all independent states in the post Second World War period, using different sources.
Unfortunately, the dataset stops at 2000, but it is still a valuable resource for social researchers.
Although the information aggregated and compiled by Skrede Gleditsch is very valuable, it is of low practical use due to the large amount of data, which makes it difficult to be represented in a meaningful way. In order to be able to get a sense of the relationships between countries it is not sufficient to have the raw amount of trade between countries.
Using matrices to represent the data
The most convenient way to work with such data is by using a Weighting matrix. That is, a row-normalized square matrix with zeros in the diagonal.
- squared, because it must include all possible dyadic (country-to-country) relationships. The best way to represent it is by using a matrix with the same number of rows and columns, where each cell represent the value of the relationship between the country of origin (row) and the country of destination (column).
- row normalized, because the goal is to have a measure of the connection between each country and the rest of the units. So that the values in a single row have to be normalized. That is, they must represent a percentage of relationship between 0 and 1, with the sum of all of them being equal to 1.
- zeros in the diagonal, because the relationship between the country and itself is not relevant. Since the diagonal cells are those representing the same country in the origin and destination, they must be fixed at 0.
The following figure represents the weighting matrix of imports for all the countries in the sample for the year 2000. The color of the squares represents the strength of the relationship in commercial terms of country in the row versus all other countries (in the columns). A darker color means that the country in the row imports a great percentage of its total imports from the country in the column. By contrast, lighter squares represent weak commercial ties (from the perspective of row countries). Consult the list of abbreviations of the country names.
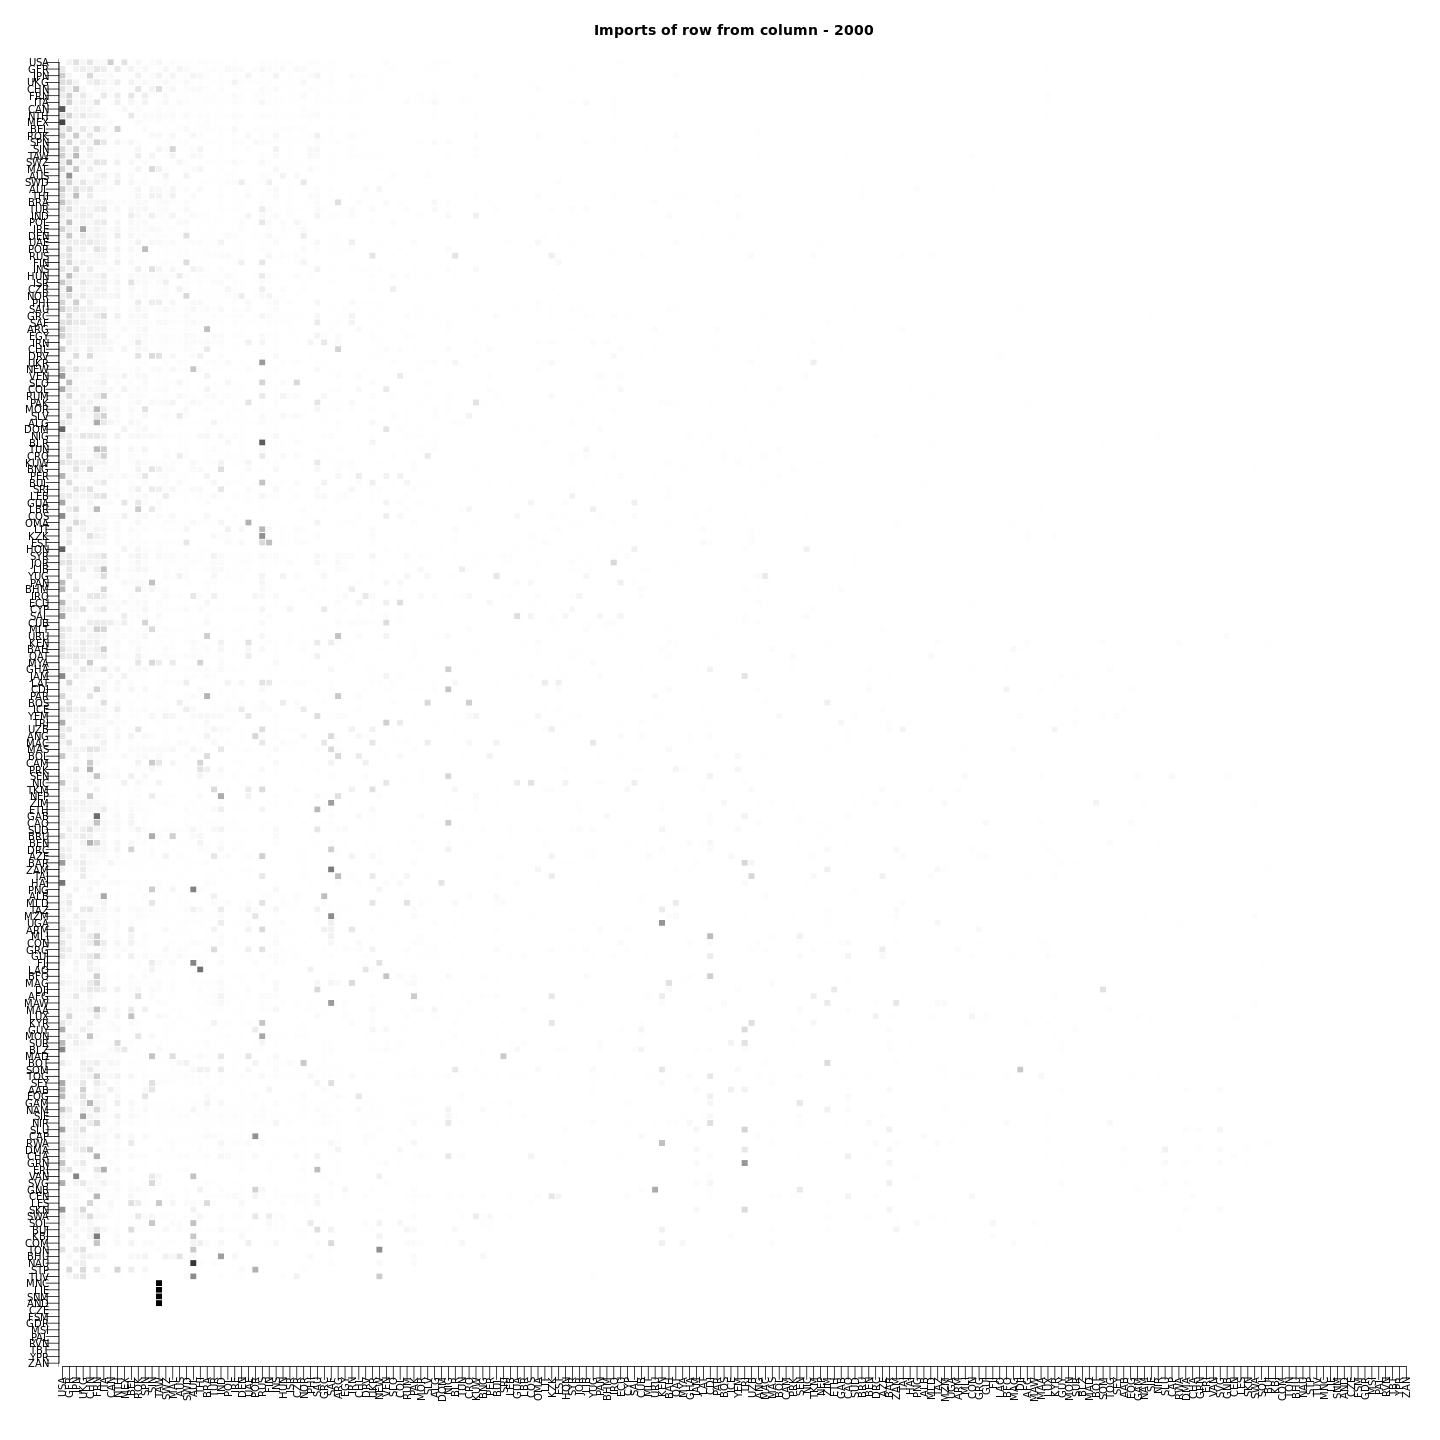
Historical perspective on commercial relationships
In addition to the fixed photo for a single year, the dataset provides historical perspective. In this case, a concatenation of images is necessary. The following video shows 60 years of imports between the 25 countries with higher amount of commercial activity in 2000. The weights in this case are calculated only between them.
<video width=“650”, height=“640” controls=“controls”>
There are many things to comment out about this video.
- Immediately after the War, most of the countries concentrate their imports in a single partner, the USA. This is why the first column is dark. All countries in the row (origin countries) have a great percentage of imports with the USA.
- The imports become less concentrated in the USA, except for Mexico and Canada, where they still have the USA as the main market to buy.
- Japan becomes a relevant commercial partner in the 70s.
- Although there are many variations, the main picture remains pretty stable.
The importance of weighting matrices
The weighting matrices not only help visualizing the raw data, but also are the intermediate value needed in many research designs that employ spatial regression techniques.
Code to generate the plots and the video
The plots have been generated in R using the “color2Dmatplot” function created by Jim Lemon, in the plotrix package. Ideally, a Hinton Diagram would be the best option to represent weighting matrices, but it is not yet available in R.
## -- Imports, Global, 25 biggest countries
xc for (t in 1:length(dimnames(imp)$year)) {
  svg(file=paste("plots-weights/import-25countries-", dimnames(imp)$year[t], ".svg", sep=""),
    width=10, height=10)
  cl   color2D.matplot(W.imp[t,xc,xc],
    border="white", cellcolors=cl,
    show.legend=FALSE, axes=FALSE, xlab="", ylab="")
  axis(1, at=0.5:length(Nc[xc]), labels=namc[xc], las=2, cex.axis=1)
  axis(2, at=rev(0.5:length(Nc[xc])), labels=namc[xc], las=1, cex.axis=1)
  title(paste("Imports of row from column", dimnames(imp)$year[t], sep=" - "))
  dev.off()
}
The “W.imp” object is the weighting matrix. In fact, it is three dimensions array, with the years in the first dimension, the origin country in the second and the destination countries in the third.
Independent plot files have been glued using mencoder.
mencoder mf://import-25countries-*.png \
-mf fps=1:type=png \
-ovc lavc \
-lavcopts vcodec=mpeg4 \
-oac copy \
-o video-commerce_imports_25.avi
The Ogg Theora version of the video has been obtained by using ffmpeg2theora.
ffmpeg2theora video-commerce_imports_25.avi