Release of the CONSENSUS dataset: an opportunity for social and environmental researchers
Author: Xavier Fernández-i-Marín
March 15, 2021 - 11 minutes
Data visualization PolicyPortfoliosAt the Chair for empirical theory of politics we are proud to publicly release the dataset of the CONSENSUS research project through the R package PolicyPortfolios.
Citation
When using the CONSENSUS dataset please cite it using:
Fernández-i-Marín, Knill, Steinebach (2021). Studying Policy Design Quality in Comparative Perspective. American Political Science Review. doi: 10.1017/S0003055421000186.
Knill, Schulze & Tosun (2012). Regulatory Policy Outputs and Impacts. Exploring a Complex Relationship. Regulation & Governance, 5(4), 427-444. doi: 10.1111/j.1748-5991.2012.
When using the PolicyPortfolios package, please cite it using:
- Fernández-i-Marín (2020): Using PolicyPortfolios (http://xavier-fim.net/post/using_policyportfolios/).
Data release and and accompanying software
Both tools are available from the R statistical software and can be installed using:
install.packages("PolicyPortfolios")The package contains the full set of social and environmental data in the form of a policy portfolio, as well as a set of functions developed to make its treatment easy for researchers.
To load the dataset you only need to load the package and the data:
library(PolicyPortfolios)
data(consensus)
## ℹ Loading PolicyPortfolios## Package 'PolicyPortfolios' version 0.2.2
## Type 'citation("PolicyPortfolios")' for citing this R package
## or its datasets in publications.Contents of the dataset
This loads the object consensus containing the full policy portfolios for the
social and environmental sectors into R’s memory.
A policy portfolio is a collection of simple assessments of the presence or
absense of state intervention in a specific area (Target) using a concrete state
capacity (Instrument).
The object is a tidy data frame (or tibble) with 6 columns, 5 identifying the unit (Sector, Country, Year, Instrument and Target) and 1 identifying whether such policy space is covered by public intervention or not.
str(consensus)## tibble [509,220 × 6] (S3: tbl_df/tbl/data.frame)
## $ Sector : Factor w/ 2 levels "Environmental",..: 1 1 1 1 1 1 1 1 1 1 ...
## $ Country : Factor w/ 23 levels "Australia","Austria",..: 1 1 1 1 1 1 1 1 1 1 ...
## $ Year : int [1:509220] 1976 1977 1978 1979 1980 1981 1982 1983 1984 1985 ...
## $ Instrument: Factor w/ 19 levels "Allowance","Bonus / Grant",..: 7 7 7 7 7 7 7 7 7 7 ...
## $ Target : Factor w/ 67 levels "Air quality standards for nitrogen oxides (Nox)",..: 1 1 1 1 1 1 1 1 1 1 ...
## $ covered : int [1:509220] 0 0 0 0 0 0 0 0 0 0 ...consensus| Sector | Country | Year | Instrument | Target | covered |
|---|---|---|---|---|---|
| Environmental | Australia | 1976 | Obligatory standards | Air quality standards for nitrogen oxides (Nox) | 0 |
| Environmental | Australia | 1977 | Obligatory standards | Air quality standards for nitrogen oxides (Nox) | 0 |
| Environmental | Australia | 1978 | Obligatory standards | Air quality standards for nitrogen oxides (Nox) | 0 |
| Environmental | Australia | 1979 | Obligatory standards | Air quality standards for nitrogen oxides (Nox) | 0 |
| Environmental | Australia | 1980 | Obligatory standards | Air quality standards for nitrogen oxides (Nox) | 0 |
| Environmental | Australia | 1981 | Obligatory standards | Air quality standards for nitrogen oxides (Nox) | 0 |
| Environmental | Australia | 1982 | Obligatory standards | Air quality standards for nitrogen oxides (Nox) | 0 |
| Environmental | Australia | 1983 | Obligatory standards | Air quality standards for nitrogen oxides (Nox) | 0 |
| Environmental | Australia | 1984 | Obligatory standards | Air quality standards for nitrogen oxides (Nox) | 0 |
| Environmental | Australia | 1985 | Obligatory standards | Air quality standards for nitrogen oxides (Nox) | 0 |
The CONSENSUS dataset includes the following units:
- Sectors: Environmental, Social
- Countries: Australia, Austria, Belgium, Canada, Denmark, Finland, France, Germany, Greece, Ireland, Italy, Japan, Netherlands, New Zealand, Norway, Portugal, South Korea, Spain, Sweden, Switzerland, Turkey, United Kingdom, United States
- Year range: 1976, 2005
The data release is completed with the list and meta-data of policy instruments (19 instruments, 13 in the environmental sector and 6 in the social sector):
data(consensus.instruments)
consensus.instruments| Instrument | instrument.id | Sector | Type |
|---|---|---|---|
| Obligatory standards | 101 | Environmental | Interventionist |
| Prohibition / Ban | 102 | Environmental | Interventionist |
| Technological prescription | 103 | Environmental | Interventionist |
| Tax / Levy | 104 | Environmental | Economic |
| Subsidy / Tax | 105 | Environmental | Economic |
| Liability scheme | 106 | Environmental | Economic |
| Planning instruments | 107 | Environmental | Interventionist |
| Public investment | 108 | Environmental | Economic |
| Data collection / Monitoring | 109 | Environmental | Interventionist |
| Information-based instruments | 110 | Environmental | Information-based |
| Voluntary instruments | 111 | Environmental | Information-based |
| Other - Environmental | 112 | Environmental | Other |
| Permits | 113 | Environmental | Interventionist |
| Contribution / Fee | 203 | Social | NA |
| Tax exemption / Subsidy | 204 | Social | NA |
| Bonus / Grant | 205 | Social | NA |
| Retention | 206 | Social | NA |
| Other - Social | 207 | Social | NA |
| Allowance | 208 | Social | NA |
And also policy targets (67 targets, 49 in the environmental sector and 19 in the social sector):
data(consensus.targets)
consensus.targets| Target | target.id | Sector | Subsector |
|---|---|---|---|
| Air quality standards for nitrogen oxides (NOₓ) | 1 | Environmental | Clean air |
| Air quality standards for sulphur dioxide (SO₂) | 2 | Environmental | Clean air |
| Air quality standards for carbon monoxide (CO) | 3 | Environmental | Clean air |
| Air quality standards for particulate matter | 4 | Environmental | Clean air |
| Air quality standards for ozone (O₃) | 5 | Environmental | Clean air |
| Air quality standards for lead | 6 | Environmental | Clean air |
| Nitrogen oxides (NOₓ) emissions from large combustion plants of the smallest size as defined by the legal act | 7 | Environmental | Clean air |
| Nitrogen oxides (NOₓ) emissions from passenger vehicles using unleaded gasoline | 8 | Environmental | Clean air |
| Nitrogen oxides (NOₓ) emissions from heavy vehicles destined for the transportation of goods using diesel | 9 | Environmental | Clean air |
| Sulphur dioxide (SO₂) emissions from large combustion plants of the smallest size as defined by the legal act | 10 | Environmental | Clean air |
| Sulphur dioxide (SO₂) emissions from passenger vehicles using unleaded gasoline | 11 | Environmental | Clean air |
| Sulphur dioxide (SO₂) emissions from heavy vehicles destined for the transportation of goods using diesel | 12 | Environmental | Clean air |
| Carbon dioxide (CO2) emissions from large combustion plants of the smallest size as defined by the legal act | 13 | Environmental | Clean air |
| Carbon dioxide (CO2) emissions from passenger vehicles using unleaded gasoline | 14 | Environmental | Clean air |
| Carbon mono oxide (CO) emissions from large combustion plants of the smallest size as defined by the legal act | 15 | Environmental | Clean air |
| Carbon mono oxide (CO) emissions from passenger vehicles using unleaded gasoline | 16 | Environmental | Clean air |
| Particulate matter emissions from large combustion plants of the smallest size as defined by the legal act | 17 | Environmental | Clean air |
| Arsenic emissions from stationary sources | 18 | Environmental | Clean air |
| Maximum permissible limit for the lead content of petrol (gasoline, benzine, fuel) | 19 | Environmental | Clean air |
| Maximum permissible limit for the sulphur content of diesel | 20 | Environmental | Clean air |
| Lead in continental surfaces water | 21 | Environmental | Water protection |
| Copper in continental surfaces water | 22 | Environmental | Water protection |
| Nitrates in continental surfaces water | 23 | Environmental | Water protection |
| Phosphates in continental surfaces water | 24 | Environmental | Water protection |
| Zinc in continental surfaces water | 25 | Environmental | Water protection |
| Oils in continental surfaces water | 26 | Environmental | Water protection |
| Pesticides (fungicides, herbicides, insecticides, exempt DDT) in continental surfaces water | 27 | Environmental | Water protection |
| DDT (Dichloro-Diphenyl-Trichloroethane) in continental surfaces water | 28 | Environmental | Water protection |
| Phenols in continental surfaces water | 29 | Environmental | Water protection |
| BOD (Biochemical Oxygen Demand) of continental surfaces water | 30 | Environmental | Water protection |
| Lead from industrial discharges from industrial discharges into continental surfaces water | 31 | Environmental | Water protection |
| Copper from industrial discharges from industrial discharges into continental surfaces water | 32 | Environmental | Water protection |
| Nitrates from industrial discharges from industrial discharges into continental surfaces water | 33 | Environmental | Water protection |
| Phosphates from industrial discharges into continental surfaces water | 34 | Environmental | Water protection |
| Chlorides from industrial discharges into continental surfaces water | 35 | Environmental | Water protection |
| Sulphates from industrial discharges into continental surfaces water | 36 | Environmental | Water protection |
| Iron from industrial discharges into continental surfaces water | 37 | Environmental | Water protection |
| Zinc from industrial discharges into continental surfaces water | 38 | Environmental | Water protection |
| Oils and greases from industrial discharges into continental surfaces water | 39 | Environmental | Water protection |
| Pesticides and herbicides from industrial discharges into continental surfaces water | 40 | Environmental | Water protection |
| Phenols from industrial discharges into continental surfaces water | 41 | Environmental | Water protection |
| Coliform bacteria from industrial discharges into continental surfaces water | 42 | Environmental | Water protection |
| BOD (Biochemical Oxygen Demand) from industrial discharges into continental surfaces water | 43 | Environmental | Water protection |
| COD (Chemical Oxygen Demand) from industrial discharges into continental surfaces water | 44 | Environmental | Water protection |
| Measures to protect native forests | 45 | Environmental | Nature conservation |
| The introduction / extension / reduction of nature protection areas/nature reserve | 46 | Environmental | Nature conservation |
| The introduction / extension / reduction of import and export of regulations for endangered plants | 47 | Environmental | Nature conservation |
| The introduction / extension / reduction of import and export of regulations for endangered species | 48 | Environmental | Nature conservation |
| Basic Unemployment benefits | 49 | Social | Unemployment benefits |
| Special Unemployment benefits: bad weather; seasonal unemployment benefits | 50 | Social | Unemployment benefits |
| Special Unemployment benefits: emergency aid | 51 | Social | Unemployment benefits |
| Special Unemployment benefits: special holiday payments | 52 | Social | Unemployment benefits |
| Special Unemployment benefits: partial unemployment benefits | 53 | Social | Unemployment benefits |
| Special Unemployment benefits: other | 54 | Social | Unemployment benefits |
| Support for vocational education and training/ vocational reintegration expenses | 56 | Social | Unemployment benefits |
| People’s Pension (standard-employee pension) for singles | 61 | Social | Pensions |
| People’s Pension (standard-employee pension) for married couples | 62 | Social | Pensions |
| People’s Pension (standard-employee pension) for unmarried couples | 63 | Social | Pensions |
| Additional People’s Pension for singles | 64 | Social | Pensions |
| Additional People’s Pension for married couples | 65 | Social | Pensions |
| Additional People’s Pension for unmarried couples | 66 | Social | Pensions |
| Special Pensions for singles | 67 | Social | Pensions |
| Special Pensions for married couples | 68 | Social | Pensions |
| Special Pensions for unmarried couples | 69 | Social | Pensions |
| Children | 73 | Social | Child benefits |
| Juveniles | 74 | Social | Child benefits |
| Payments for giving birth to children | 75 | Social | Child benefits |
Convenient treatment of policy portfolios data
The set of functions in the package, coupled with R’s own functions makes the treatment of the date very easy.
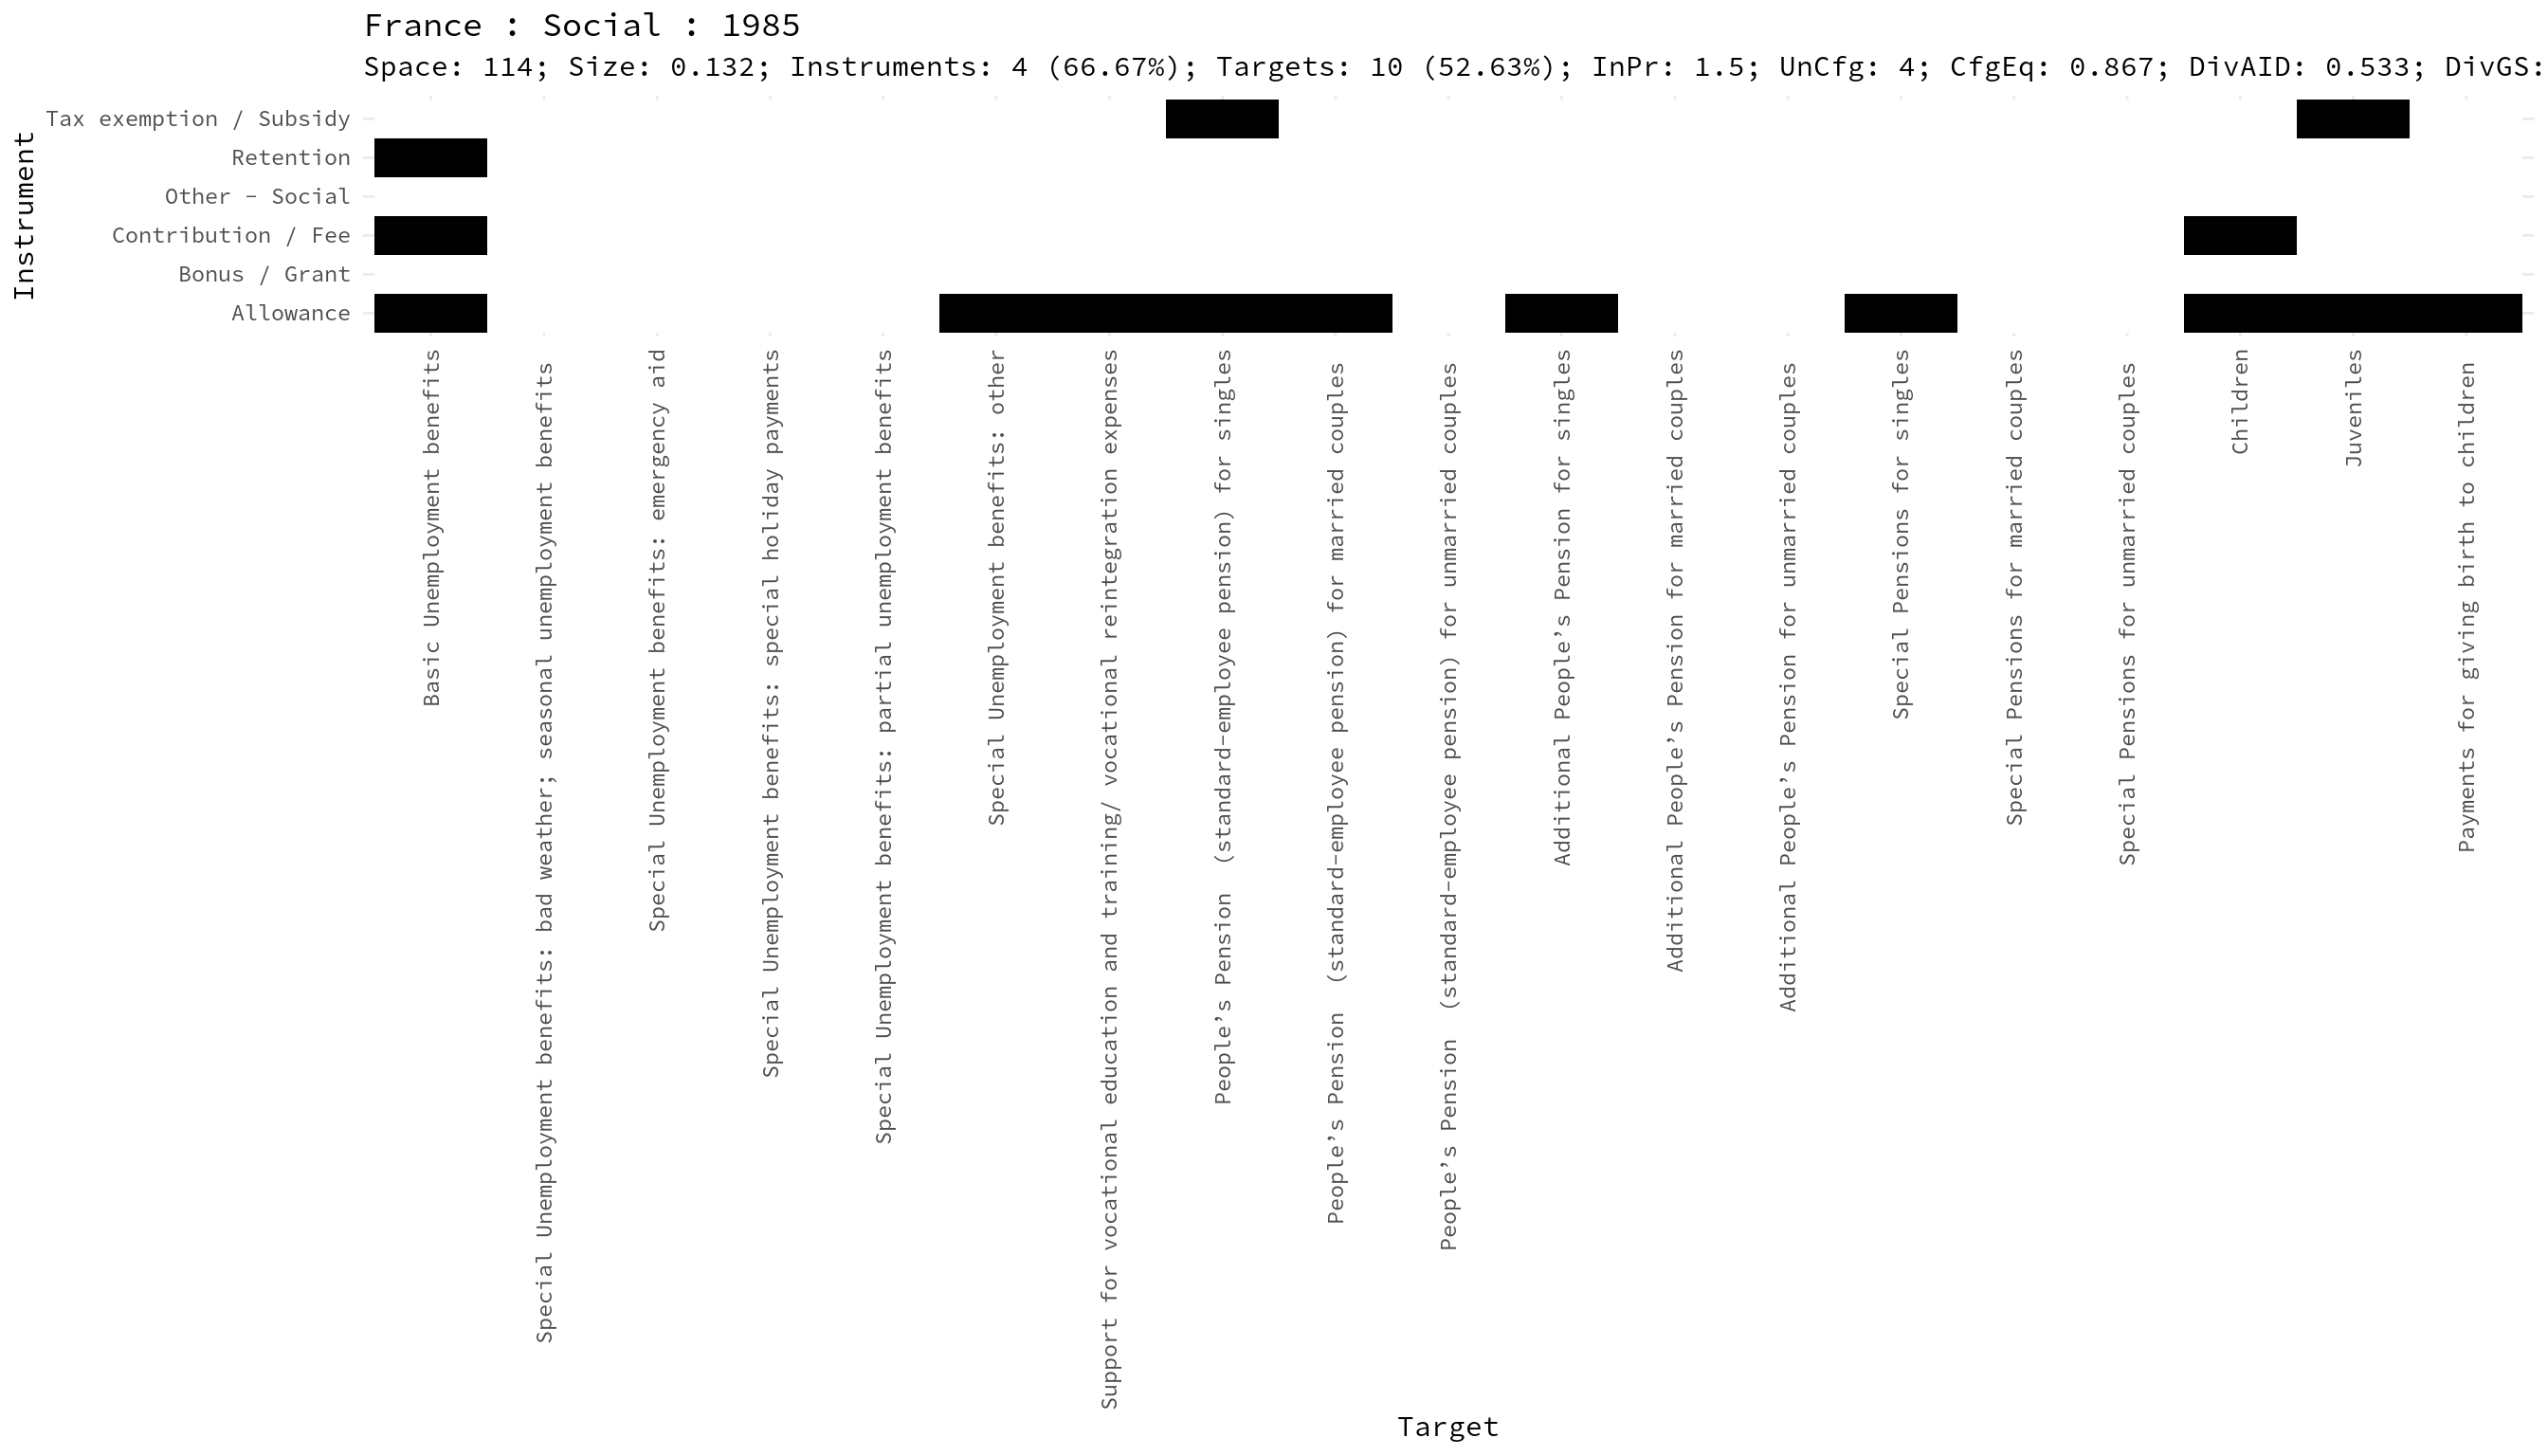
Plotting a specific portfolio can be achieved by the function pp_plot
specifying the Sector, Country and Year:
# Use the argument 'id' to pass a list of sectors, countries or years.
pp_plot(consensus, id = list(Sector = "Social",
                             Country = "France",
                             Year = 1985))
Figure 1: Example of the use of the pp_plot() function, for the social portfolio in France in 1985.
As of version 0.2.2 (March 2021), the function pp_measures() allows to easily retrieve the following measures of the characteristics of the portfolios:
- Space: how many policy spaces does it contain (Instruments * Targets)
- Size: proportion of space covered by policy intervention (Adam, Knill, and Fernández-i-Marín 2017).
- n.Instruments: number of instruments covered at least by one target
- p.Instruments: proportion of instruments covered at least by one target
- n.Targets: number of targets covered at least by one instrument
- p.Targets: proportion of targets covered at least by one instrument
- Unique: number of unique instrument configurations
- Diversity (AID): Average Instrument Diversity (Fernández-i-Marín, Knill, and Steinebach 2021).
- Diversity (Gini-Simpson): (Simpson 1949) (Hill 1973)
- Diversity (Shannon): (Shannon 1948).
- Equality of instrument configurations.
- Equitability (Shannon): a variant of Shannon’s diversity.
- Instrument preponderance: on average, how many instruments per target.
For example, we can get a whole set of measures for the social portfolio in France in 1985.
# Use the argument 'id' to pass a list of sectors, countries or years
# for which to calculate the portfolio measures.
# It can also be achieved using pipes and filtering the data accordingly.
pp_measures(consensus, id = list(Sector = "Social",
                                 Country = "France",
Year = 1985))| Country | Sector | Year | Measure | value | Measure.label |
|---|---|---|---|---|---|
| France | Social | 1985 | Space | 114.00 | Portfolio space |
| France | Social | 1985 | Size | 0.13 | Portfolio size |
| France | Social | 1985 | n.Instruments | 4.00 | Number of instruments covered |
| France | Social | 1985 | p.Instruments | 0.67 | Proportion of instruments covered |
| France | Social | 1985 | n.Targets | 10.00 | Number of targets covered |
| France | Social | 1985 | p.Targets | 0.53 | Proportion of targets covered |
| France | Social | 1985 | Unique | 4.00 | Number of unique instrument configurations |
| France | Social | 1985 | C.eq | 0.87 | Equality of Instrument configurations |
| France | Social | 1985 | Div.aid | 0.53 | Diversity (Average Instrument Diversity) |
| France | Social | 1985 | Div.gs | 0.52 | Diversity (Gini-Simpson) |
| France | Social | 1985 | Div.sh | 1.43 | Diversity (Shannon) |
| France | Social | 1985 | Eq.sh | 0.55 | Equitability (Shannon) |
| France | Social | 1985 | In.Prep | 1.50 | Instrument preponderance |
Coupling with R’s working flow
The package works well with tidyverse packages, and its functions are easily
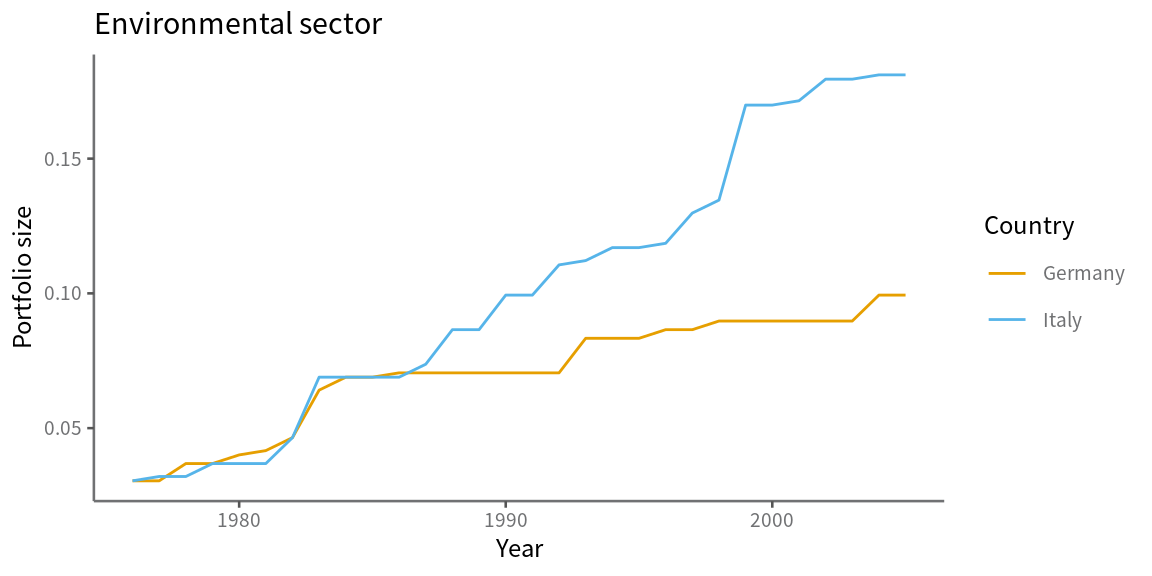
coupled with the use of pipes (%>%) in R. For instance, plotting the
portfolio size for two countries can be achieved with a combination of the
package functions and the tidyverse tools:
library(ggplot2)
consensus %>%
  # Start with the whole dataset and limit its scope by sector and country
  filter(Sector == "Environmental") %>%
  filter(Country %in% c("Germany", "Italy")) %>%
  # Ensure that only the relevant factor levels are passed
  droplevels() %>%
  # calculate the measures for each Country and Year
  pp_measures() %>%
  # Only keep the size of the portfolio as a Measure to pass to ggplot()
  filter(Measure == "Size") %>%
  ggplot(aes(x = Year, y = value, color = Country)) +
  geom_line() +
  ylab("Portfolio size") +
  ggtitle("Environmental sector") +
  scale_color_manual(values = c("#E69F00", "#56B4E9"))
Figure 2: Environmental portfolio size for Germany and Italy over time.
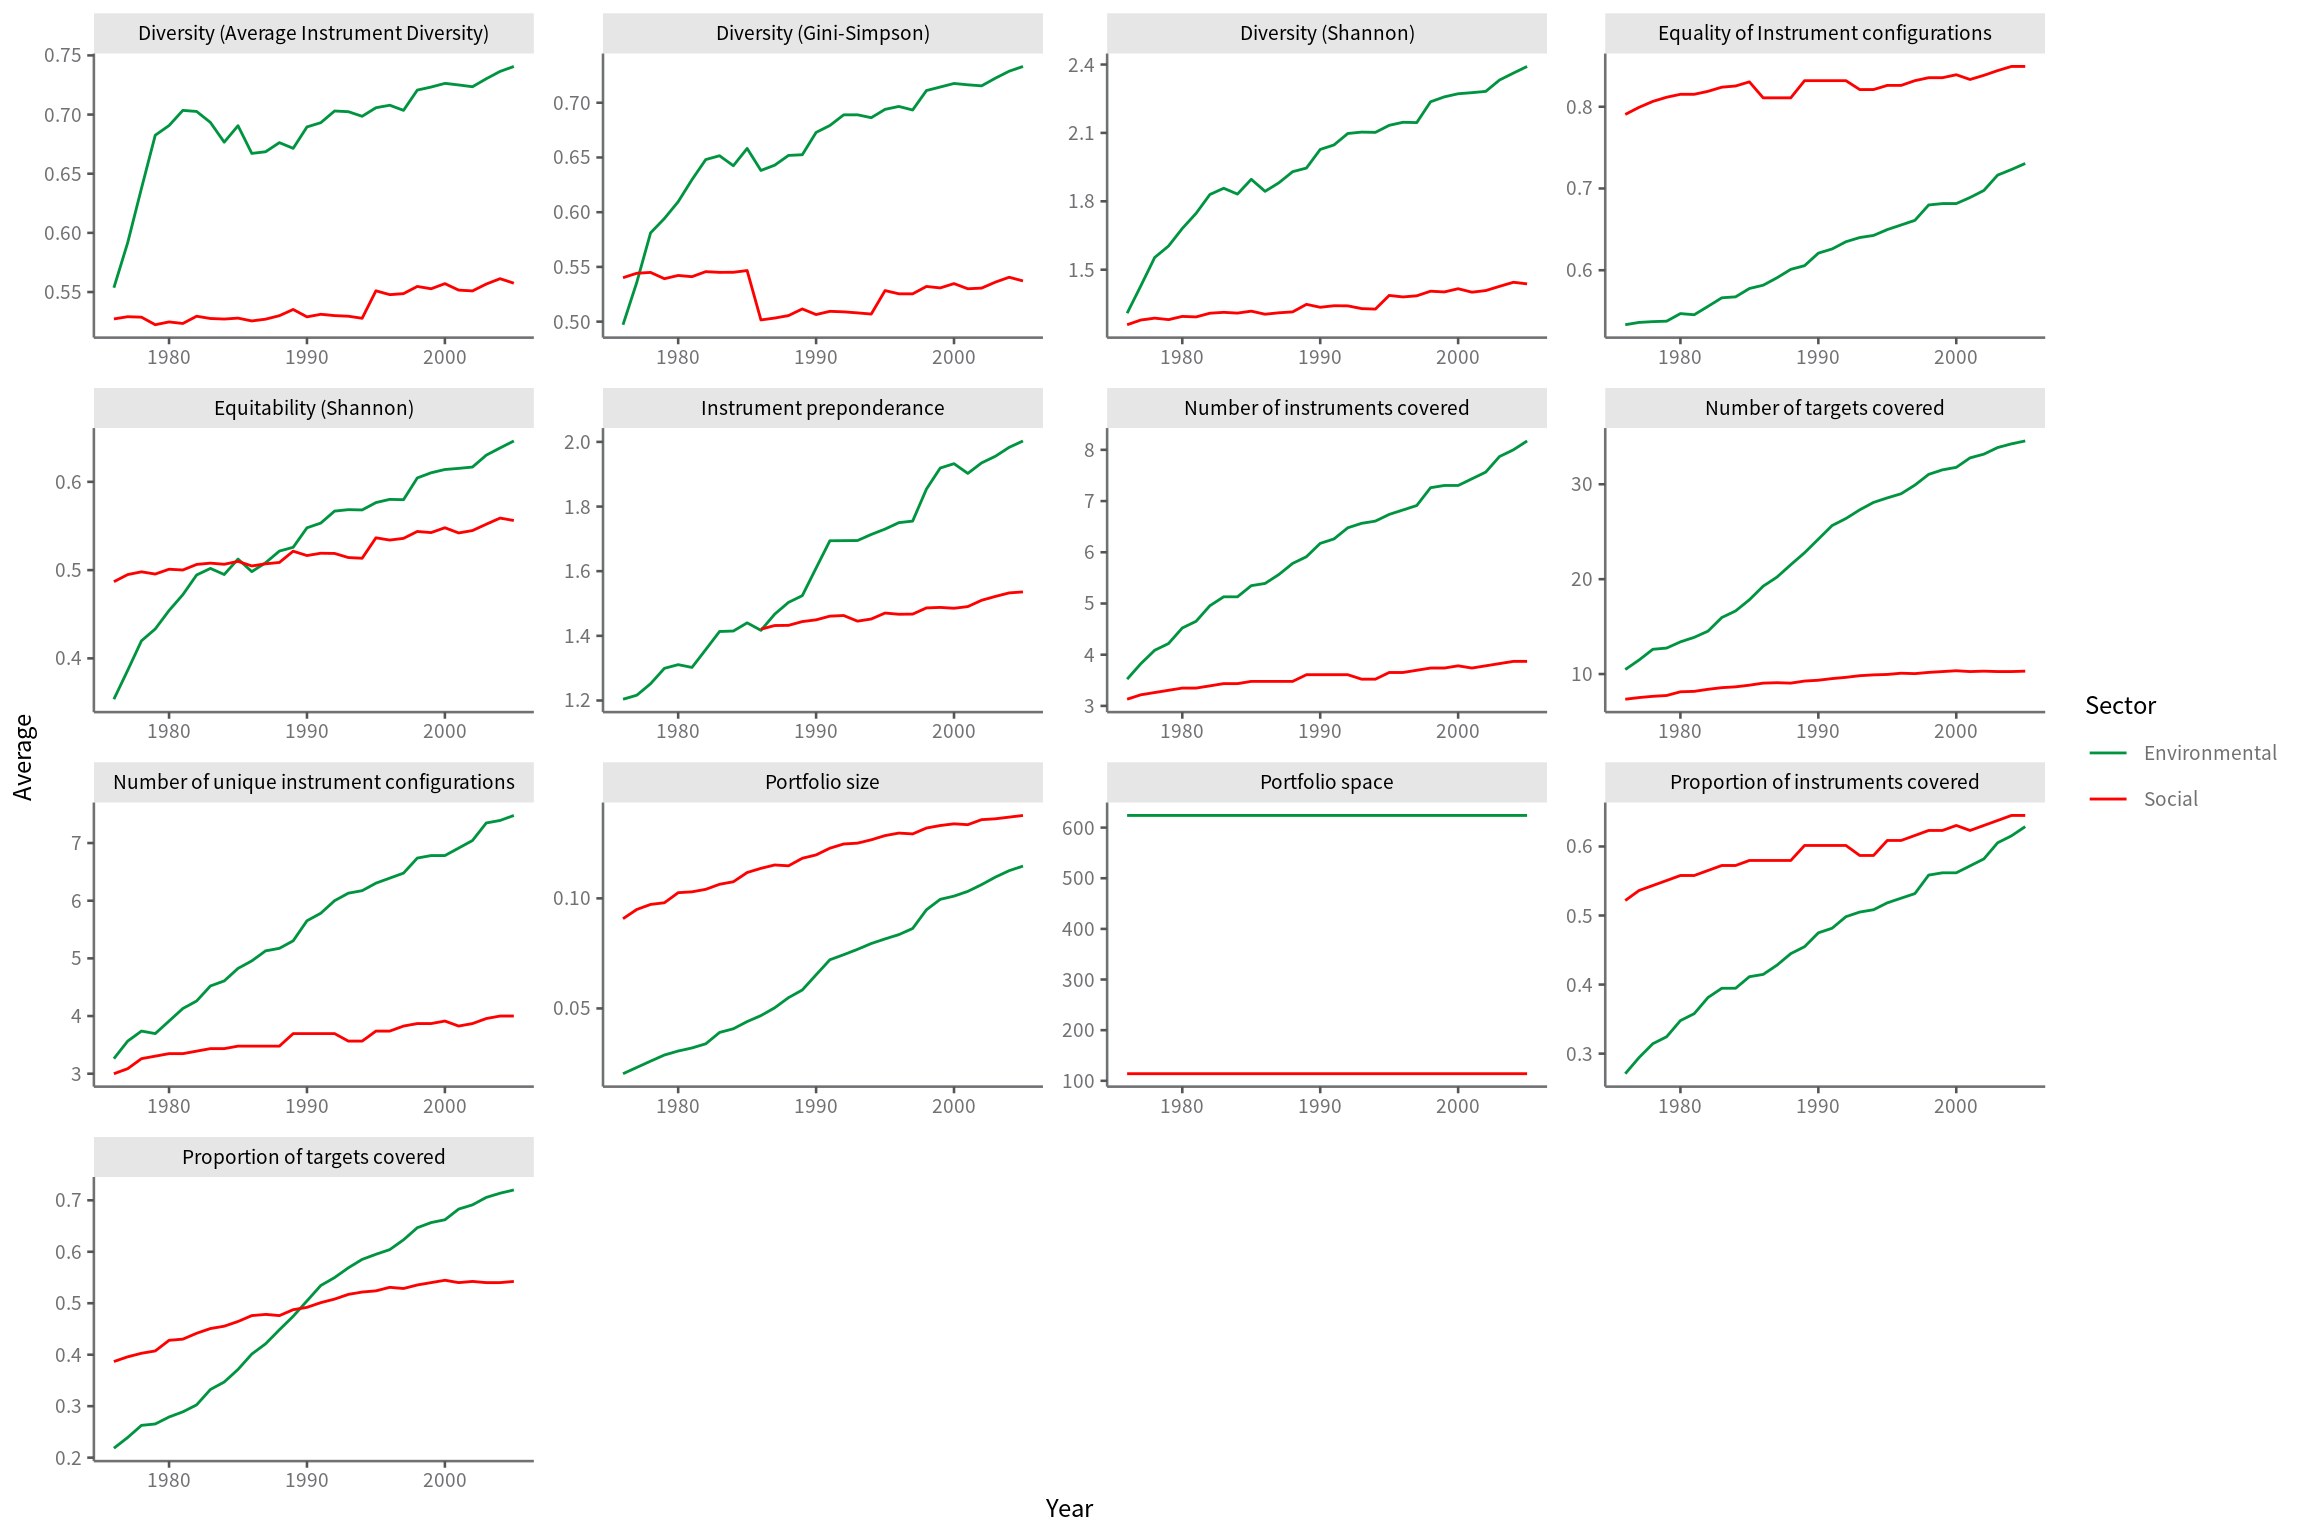
Or summarizing the averages of all portfolio measures available by countries:
bind_rows(
  # Treat the environmental and social sectors separately
  # as they do not contain the same Instruments and Targets
  filter(consensus, Sector == "Environmental") %>%
    droplevels() %>%
    pp_measures(),
  filter(consensus, Sector == "Social") %>%
    droplevels() %>%
    pp_measures()) %>%
  # Once the measures have been calculated for each set of sectors
  # bind the rows together and calculate the average over countries
  group_by(Sector, Year, Measure.label) %>%
  summarize(Average = mean(value)) %>%
  # finally pass the data to ggplot()
  ggplot(aes(x = Year, y = Average, color = Sector)) +
  geom_line() +
  facet_wrap(~ Measure.label, scales = "free")
Figure 3: Temporal evolution of average measures of portfolio characteristics for the countries considered in the CONSENSUS dataset.
Further reading
You can learn more at:
- Package reference manual
- Vignette of the package
- Resources for policy portfolios
References
Adam, Christian, Christoph Knill, and Xavier Fernández-i-Marín. 2017. “Rule Growth and Government Effectiveness: Why It Takes the Capacity to Learn and Coordinate to Constrain Rule Growth.” Policy Sciences 50 (2): 241–68. https://doi.org/10.1111/psj.12379.
Fernández-i-Marín, Xavier, Christoph Knill, and Yves Steinebach. 2021. “Studying Policy Design Quality in Comparative Perspective.” American Political Science Review. https://doi.org/10.1017/S0003055421000186.
Hill, Mark O. 1973. “Diversity and Evenness: A Unifying Notation and Its Consequences.” Ecology 54 (2): 427–32. https://doi.org/10.2307/1934352.
Shannon, Claude E. 1948. “A Mathematical Theory of Communication.” The Bell System Technical Journal 27 (3): 379–423.
Simpson, Edward H. 1949. “Measurement of Diversity.” Nature 163 (4148): 688–88. https://doi.org/10.1038/163688a0.